Simple Linear Regression
Table of Contents
- Formulas
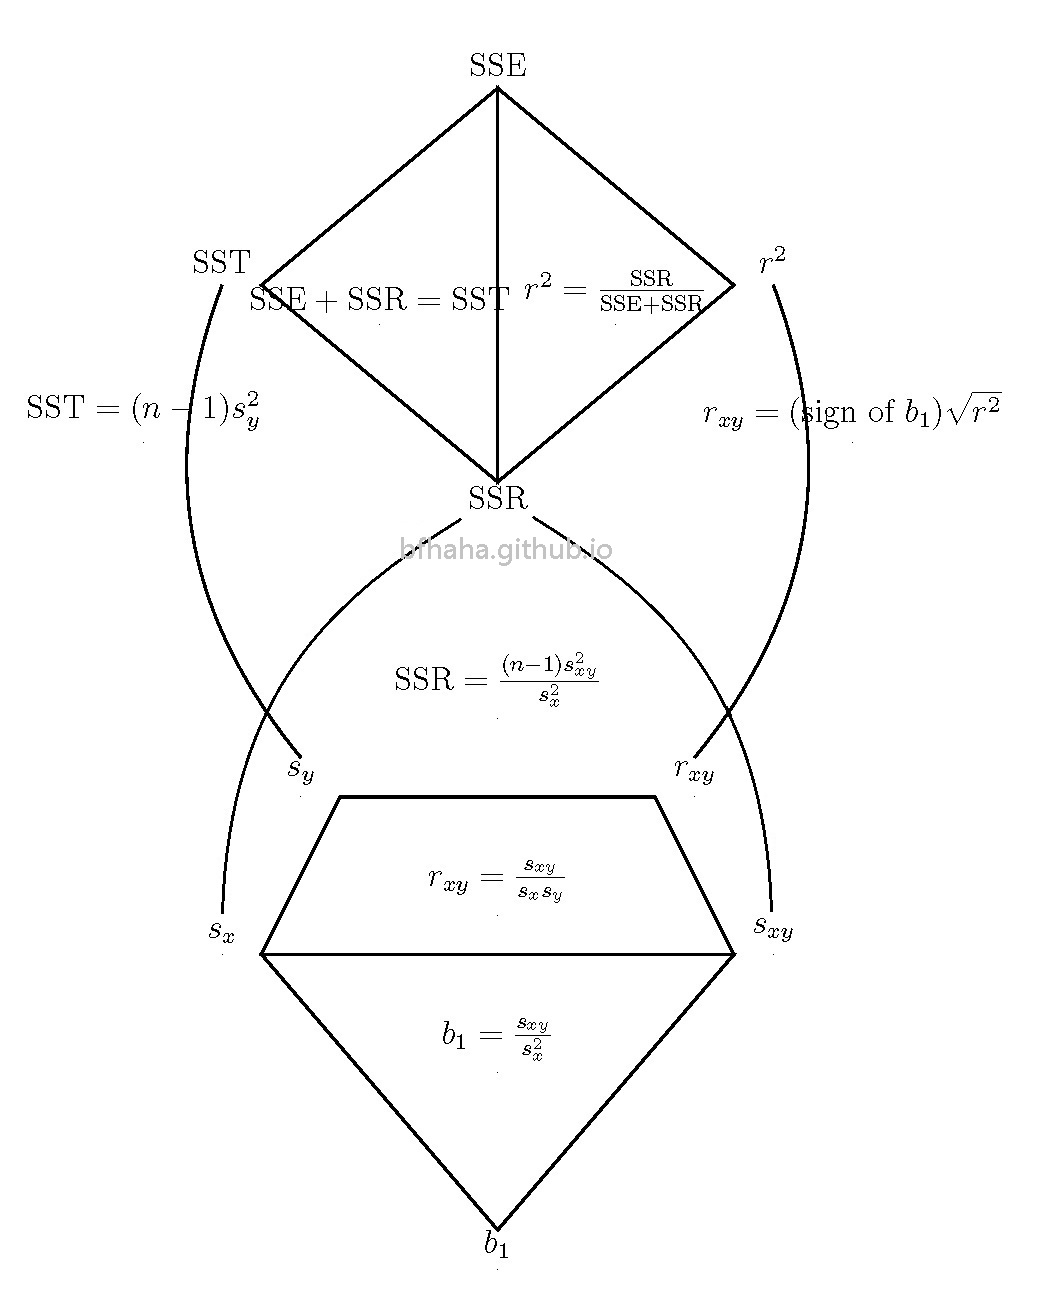
- Relationships among SSE, SSR, SST and s_x, s_y, s_xy
- Simple Linear Regression in Statistics and Least Square Line in Linear Algebra
- Simple Linear Regression in R---Syntax
- Simple Linear Regression in R---Results
- Computing F distribution and T distribution
Formulas
The page numbers refer to Anderson's Statistics for Business and Economics.
| \(\hat{y}=b_0+b_1 x\) | p.656, (14.3). | |
| \(b_1=\frac{\sum_{i=1}^{n}(x_i-\overline{x})(y_i-\overline{y})}{\sum_{i=1}^{n}(x_i-\overline{x})^2}\) | p.660, (14.7). | |
| \(b_0=\overline{y}-b_1\overline{x}\) | p.660, (14.6). | Note that this formula is very similar to \(\hat{y}=b_0+b_1 x\). |
| \(\text{SSE}=\sum_{i=1}^{n}(y_i-\hat{y}_i)^2\) | p.668, (14.8). | |
| \(\text{SSR}=\sum_{i=1}^{n}(\hat{y}_i-\overline{y})^2\) | p.669, (14.10). | |
| \(\text{SST}=\sum_{i=1}^{n}(y_i-\overline{y})^2\) | p.669, (14.9). | |
| \(\text{SSE}+\text{SSR}=\text{SST}\) | p.679, (14.11). | |
| \(\hat{\sigma}=\sqrt{\frac{\text{SSE}}{n-2}}\) | p.677, (14.16). | |
| \(\hat{\sigma}_{b_1}=\frac{\hat{\sigma}}{\sqrt{\sum_{i=1}^{n}(x_i-\overline{x})^2}}\) | p.678, (14.18). | |
| \(t=\frac{b_1-\beta_1}{\hat{\sigma}_{b_1}}\stackrel{H_0:\beta_1=0}{=}\frac{b_1}{\hat{\sigma}_{b_1}}\) | p.679, (14.19). | |
| \(r^2=\frac{\text{SSR}}{\text{SST}}\) | p.671, (14.12). | |
| \(f=\frac{\text{SSR}/1}{\text{SSE}/(n-2)}\) | p.680, (14.21). |
| \(s_x=\sqrt{\frac{\sum(x_i-\bar{x})^2}{n-1}}\) | (3.8), (3.9). |
| \(s_y=\sqrt{\frac{\sum(y_i-\bar{y})^2}{n-1}}\) | (3.8), (3.9). |
| \(s_{xy}=\frac{\sum(x_i-\bar{x})(y_i-\bar{y})}{n-1}\) | (3.13). |
| \(r_{xy}=\frac{s_{xy}}{s_x s_y}\) | (3.15). |
Relationships among SSE, SSR, SST and \(s_x, s_y, s_{xy}\)

\(\hat{\sigma}, \hat{\sigma}_{b_1}\) 沒列入。\(\text{SSE}=(n-1)\left(\frac{s_x^2 s_y^2-s_{xy}^2}{s_x^2}\right)\) 也沒列入,但不需要。
Simple Linear Regression in Statistics and Least Square Line in Linear Algebra
雖然統計學中的迴歸直線跟線性代數中的最小平方直線兩者的公式看起來不一樣,但在這裡證明其實是相同的。
\[ \begin{array}{rcl} A &=& \begin{bmatrix}x_1&1\\x_2&1\\\vdots&\vdots\\x_n&1\\\end{bmatrix} \\ A^t A &=& \begin{bmatrix}x_1&x_2&\cdots&x_n\\1&1&\cdots&1\end{bmatrix}\begin{bmatrix}x_1&1\\x_2&1\\\vdots&\vdots\\x_n&1\end{bmatrix}=\begin{bmatrix}\sum x_i^2&\sum x_i\\\sum x_i&n\end{bmatrix} \\ (A^t A)^{-1} &=& \frac{1}{n\sum x_i^2-(\sum x_i)^2}\begin{bmatrix}n&-\sum x_i\\-\sum x_i&\sum x_i^2\end{bmatrix} \\ (A^t A)^{-1}A^t &=& \frac{1}{n\sum x_i^2-(\sum x_i)^2}\begin{bmatrix}n&-\sum x_i\\-\sum x_i&\sum x_i^2\end{bmatrix}\begin{bmatrix}x_1&x_2&\cdots&x_n\\1&1&\cdots&1\end{bmatrix} \\ &=& \frac{1}{n\sum x_i^2-(\sum x_i)^2}\begin{bmatrix}nx_1-\sum x_i&nx_2-\sum x_i&\cdots&nx_n-\sum x_i\\-x_1\sum x_i+\sum x_i^2&-x_2\sum x_i+\sum x_i^2&\cdots & -x_n\sum x_i+\sum x_i^2\end{bmatrix} \\ &=& \frac{1}{n\sum x_i^2-n^2 \bar{x}^2}\begin{bmatrix}nx_1-n\bar{x}&nx_2-n\bar{x}&\cdots&nx_n-n\bar{x}\\-x_1n\bar{x}+n\frac{\sum x_i^2}{n}&-x_2n\bar{x}+n\frac{\sum x_i^2}{n}&\cdots & -x_nn\bar{x}+n\frac{\sum x_i^2}{n}\end{bmatrix} \\ &=& \frac{1}{\sum x_i^2-n \bar{x}^2}\begin{bmatrix}x_1-\bar{x}&x_2-\bar{x}&\cdots&x_n-\bar{x}\\-x_1\bar{x}+\frac{\sum x_i^2}{n}&-x_2\bar{x}+\frac{\sum x_i^2}{n}&\cdots & -x_n\bar{x}+\frac{\sum x_i^2}{n}\end{bmatrix} \\ (A^t A)^{-1}A^t \mathbf{y} &=& \frac{1}{\sum x_i^2-n \bar{x}^2}\begin{bmatrix}x_1-\bar{x}&x_2-\bar{x}&\cdots&x_n-\bar{x}\\-x_1\bar{x}+\frac{\sum x_i^2}{n}&-x_2\bar{x}+\frac{\sum x_i^2}{n}&\cdots & -x_n\bar{x}+\frac{\sum x_i^2}{n}\end{bmatrix}\begin{bmatrix}y_1\\y_2\\\vdots\\y_n\end{bmatrix} \\ &=& \frac{1}{\sum x_i^2-n \bar{x}^2}\begin{bmatrix}\sum(x_i-\bar{x})y_i\\\sum\left(-x_i\bar{x}+\frac{\sum x_i^2}{n}\right)y_i\end{bmatrix} \end{array} \] Let us see the first component. Note that \[ \sum(x_i-\bar{x})^2 =\sum x_i^2-2\sum x_i \bar{x}+\sum \bar{x}^2 =\sum x_i^2-2n\bar{x}^2+n\bar{x}^2 =\sum x_i^2-n\bar{x}^2 \] and \[ \sum(x_i-\bar{x})(y_i-\bar{y}) =\sum(x_i-\bar{x})y_i-\sum(x_i-\bar{x}\bar{y} =\sum(x_i-\bar{x})y_i. \] So the first component is \[ b_1 =\frac{\sum(x_i-\bar{x})y_i}{\sum x_i^2-n \bar{x}^2} =\frac{\sum(x_i-\bar{x})(y_i-\bar{y})}{\sum(x_i-\bar{x})^2}. \] The second component is \[ \frac{\sum\left(-x_i\bar{x}+\frac{\sum x_i^2}{n}\right)y_i}{\sum x_i^2-n \bar{x}^2} =\frac{\bar{y}\sum x_i^2-\bar{x}\sum x_i y_i}{\sum x_i^2-n \bar{x}^2}. \] We verify that \(b_0\) equals the second component. \[ \begin{array}{rcl} b_0=\bar{y}-b_1\bar{x} &=& \bar{y}-\frac{\sum(x_i-\bar{x})y_i}{\sum x_i^2-n \bar{x}^2}\bar{x} \\ &=& \frac{\bar{y}(\sum x_i^2-n\bar{x}^2)-\sum(x_i-\bar{x})y_i\bar{x}}{\sum x_i^2-n \bar{x}^2} \\ &=& \frac{\bar{y}\sum x_i^2-n\bar{x}^2\bar{y}-\bar{x}\sum x_i y_i+\bar{x}^2 n\bar{y}}{\sum x_i^2-n \bar{x}^2} \\ &=& \frac{\bar{y}\sum x_i^2-\bar{x}\sum x_i y_i}{\sum x_i^2-n \bar{x}^2} \end{array} \]
Simple Linear Regression in R---Syntax
x=c(x, ...)
y=c(y, ...)
model=lm(y~x)
summary(model)
更多模型的指令參考這裡,備份如下
| Syntax | Model |
|---|---|
| y~x | \(y=\beta_0+\beta_1 x\) |
| y~x+I(x^2) | \(y=\beta_0+\beta_1 x+\beta_2 x^2\) |
| y~x1+x2 | \(y=\beta_0+\beta_1 x_1+\beta_2 x_2\) |
| y~x1*x2 | \(y=\beta_0+\beta_1 x_1+\beta_2 x_2+\beta_3 x_1 x_2\) |
Simple Linear Regression in R---Results
| Coefficients: | |||||
| Estimate | Std. Error | t value | Pr(>|t|) | ||
| (Intercept) | \(b_0=\overline{y}-b_1\overline{x}\) | *** | |||
| x | \(b_1=\frac{\sum_{i=1}^{n}(x_i-\overline{x})(y_i-\overline{y})}{\sum_{i=1}^{n}(x_i-\overline{x})^2}\) | \(\hat{\sigma}_{b_1}=\frac{\hat{\sigma}}{\sqrt{\sum_{i=1}^{n}(x_i-\overline{x})^2}}\) | \(t=\frac{b_1}{\hat{\sigma}_{b_1}}\) | \(p\)-value associated with \(t=2(1-T(t))\) | *** |
---
Signif. codes: 解釋上面的***
Residual standard error: \(\hat{\sigma}=\sqrt{\frac{\text{SSE}}{n-2}}\) on \(n-2\) degree of freedom
Multiple R-squared: \(r^2=\frac{\text{SSR}}{\text{SST}}\), Adjusted R-squared:
F-statistic: \(f=\frac{\text{SSR}/1}{\text{SSE}/(n-2)}\), p-value: \(p\)-value associated with \(f=1-F(f)\)
The \(p\)-values associated with \(t\) is \(2(1-T(t))\), where \(T\) is the cumulative distribution function of \(t(n-1)\).
The \(p\)-values associated with \(f\) is \(1-F(f)\), where \(F\) is the cumulative distribution function of \(F(1, n-2)\).
Computing F distribution and T distribution
可以利用Wolfram Alpha輸入下面指令。
CDF[FRatioDistribution[n, m], x]
CDF[StudentTDistribution[n], x]
No comments:
Post a Comment